Analytics overview
See how your business is performing at a glance — bookings, revenue, top services and providers, and where leads are coming from.
Updated Sep 13, 20262 min read
Analytics gives you a live picture of the business over any date range, without exporting anything.
Choose a period
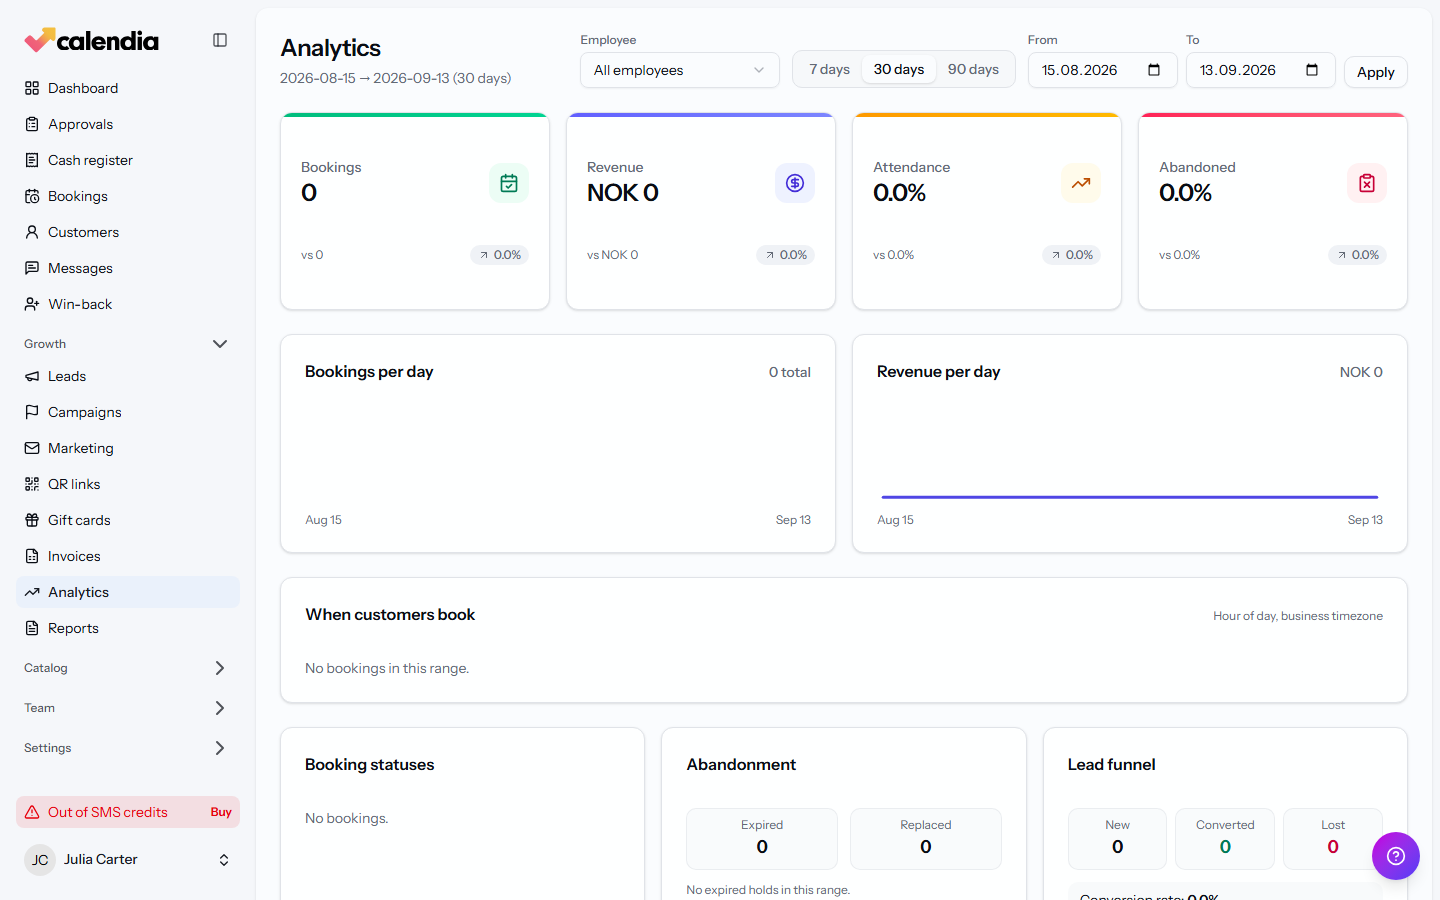
- Open Analytics from Growth in the sidebar.
- Optionally filter by Employee, then set the From and To dates.
- Click Apply.
What you'll see
- Summary cards for Bookings, Revenue, Attendance, and Abandoned bookings for the period.
- Bookings per day and Revenue per day charts, plus When customers book (by hour of day, in your business's timezone) and a breakdown of Booking statuses.
- Abandonment, split into Expired and Replaced holds, so you can see how many potential bookings never completed.
- A Lead funnel (New, Converted, Lost) with an overall Conversion rate, and totals for New customers, Active customers, and the customer base as a whole.
- Top services and Top providers tables, each ranked by bookings and revenue.
- Working days and absence for the team, and a list of Recently abandoned holds with the contact and slot they wanted.
- Results from Marketing campaigns sent in the period — recipients, sent, and failed counts.
For a downloadable, dated record instead of a live view, see Reports and exports.